The control panel is the area where you will find all the controls to configure the network according to your needs:
Filters
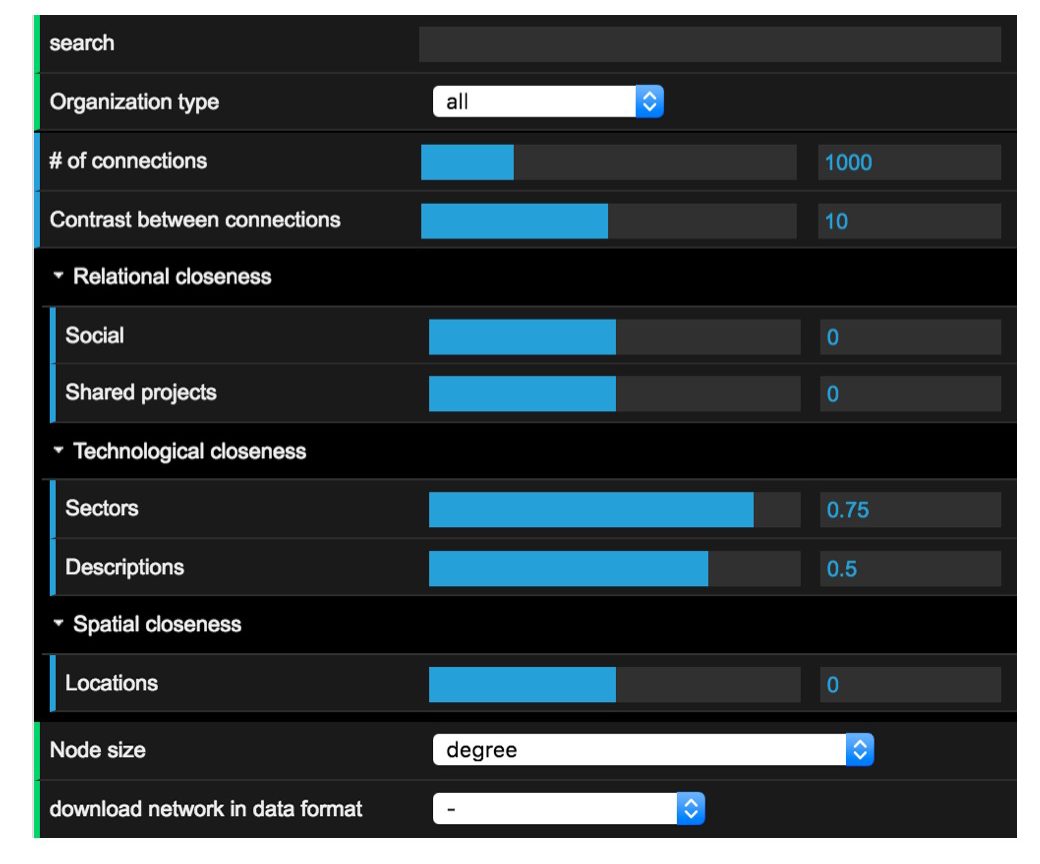
- Search: Allows to search within each organisation’s name and description. The results of the search will appear in the network visualisation as highlighted (coloured) organisations. You can separate words using commas to build more advanced queries. E.g. “wind, power”
- Organisation type: You can filter organisations according to their categories in the system. The results of your selection will appear in the network visualisation as highlighted (coloured) organisations.

Overall network configuration
- Number of connections: The network can be adjusted to show between 10 and 4000 connections. A low number of connections highlights the strongest links between organisations only. A higher number allows you to have a more extensive view of the network.
- Contrast between connections: Most of the times the best setting is “0”. This means that the different network layers selected will be combined linearly. If you prefer to focus only on the connections found in the strongest layers, and cut connections from weaker layers, then you con experiment increasing the value of this setting.
Relational closeness
 This section controls the network layer that connects organisations based on their previous relational connections. This includes relationships based on personal contacts (named here as social) and based on shared projects (i.e. a connection will exist between two organisations if they participate in one or more projects together).
- Social: Please select a value between 0 and 1 that reflects the relative weight that you want to assign to connections based on personal contacts.
- Shared project: Please select a value between 0 and 1 that reflects the relative weight that you want to assign to connections based on previous participation in projects.
Technological closeness
 This section controls the network layer that connects organisations based on their technological similarity. This includes sector-based similarity (organisations that work in one or more of the same sectors) and technological closeness based on similarities in their text descriptions (based on their public profiles).
- Sectors: Please select a value between 0 and 1 that reflects the relative weight that you want to assign to connections based on shared technology/industrial sectors.
- Descriptions: Please select a value between 0 and 1 that reflects the relative weight that you want to assign to connections based on similarities between the public profiles (text descriptions) of the organisations.
![]()
Spatial closeness
This section controls the network layer that connects organisations based on their geographical closeness. The physical distance between each organisations is calculated based on the latitude and longitude of their main location within Denmark.
- Locations: Please select a value between 0 and 1 that reflects the relative weight that you want to assign to connections based on spatial/geographical proximity.

Node size: This setting allows you to set the size of each organisation according to key network metrics. For a review of some of the most important network analysis metrics please visit this review.

Download network in data format: This allows downloading the network that is currently being visualised. This setting is intended for users that require exporting the data for further analyses.